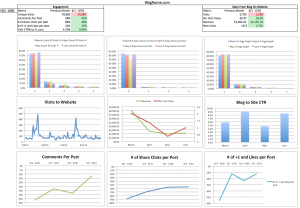
I built a dashboard for measuring the success of these two silos on a monthly basis. Check it out:
Measuring engagement has multiple facets. How well does your content attract new visitors, get people to come back, bring in others via social sharing and just be all around worth reading? The top left column pulls in those metrics of measuring how engaging the content is by using comments, shares and likes as a proxy for quality. Likewise the first row of bar charts shows the count of visits, days since last visit and page depth – pulled from Google analytics, over the last 4 months. Seeing these trended out gives you an idea if your content is getting better or worse over time – same with the line social graphs in the bottom row.
Next, how well does the blog get people to buy from your site? The first step to driving a sale is to get people from the blog to the site, so the Visits to Website line graph and the Blog to Site CTR shows how many, and with what frequency people are clicking through. The middle chart on the middle row shows overall revenue and per visit value.
A dashboard is only as good as the actionable insights one can glean from it. This dashboard shows (the numbers are all made up mind you) that last month the content got better – people commented more, shared more and Liked more. The next step here would be to pull the All Pages report for the month and see what kind of content resonated so much, and then make more of it.
Despite less traffic overall the quality of traffic to the site increased as Per Visit Value increased – too bad not more people aren’t clicking through to the site, maybe more links to the site could help that. Were the links to the site product pages, category pages, the homepage?
More questions: Did the new visits this month convert? The count of visits from last month were higher, was there a theme of content that you stopped using this month? Anyway you can add onto the content that drove the spikes in visits from previous months? How does your cadence of posting affect the volume of traffic?
Download the Ecommerce Blog Dashboard in Excel.
