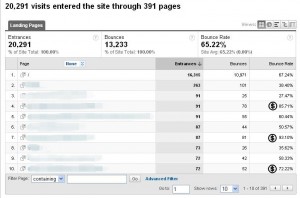
So now you can see what is failing, in one more step you can get an idea of why it is failing: Click on one of those poor performing pages (I put little cash signs next to my contenders) with a high bounce rate to analyze it on it’s own. Then click on the drop down that says Content Detail on it and select Entrance Keywords. Do the keywords people use to get to this page align with the content of the page? Looking at their keywords you can get a sense of what their intent was and why it doesn’t match up with what the page is delivering. Now you have something to work with and fix. Now make the changes to that page so that it better matches what your visitors want. Bounce rate will go down, and positive outcomes will increase.
An Easy Example Of How To Use Google Analytics To Improve Your Site
This is one of the first things I look at when I analyze any website. Under Content in the left column click on Top Landing Pages. These are the most frequently landed on pages that your visitors see when they first come to your website. These are your “head” pages, which means that small improvements to these pages can quickly yield high ROI. In the furthest right column in the report is the bounce rate for each of these pages. % Bounce Rate means the % of visitors that came to your site and then left instantly, or in other words, that landing page was not compelling enough for them to read more than that one page. Bounce rate is a great metric to measure the quality of the traffic you are acquiring. It helps you hone in on where and how your website is failing your visitors.
