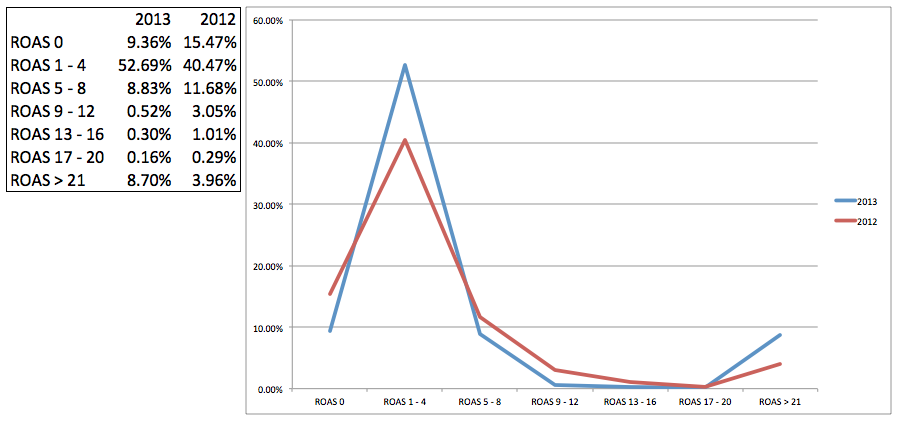
These questions can be answered by looking at the amount of money a company invests at the different levels of Return On Ad Spend (or CPA). If you compare time periods you can see how paid search strategies change.
In this example you can see that a focus on direct response was increased year over year as that sweet spot of ROAS from 1 to 4 was much more heavily invested in – budget was spread much less evenly across higher ROAS levels. There is always a balance between profit and volume the more evenly the cost is spread out the more evenly the company values both metrics
in 2012 there seems to be more experimentation going on as the amount invested that got 0 return was higher. Â Interestingly, in 2013 as the amount of money invested on the > 21 ROAS was much higher. Maybe there were a few pet keywords that even though got low return were important from a branding or competitive perspective. Or impression share on those high ROAS keywords was tapped out and additional budget was given to the wrong keywords.
