The Curse And Blessing Of Direct Traffic

One reason to analyze traffic sources is to identify which sources have the most value and to generate ideas on how to get those high value sources to perform better. If you were to ask what is the value of $100 on AdWords, your analytics tool can give you an answer. Often paid search and other channels are combined along the path to purchase causing a multi channel funnel, but there is still a significant amount of sales that search is solely responsible for.

Not so with direct traffic because unlike other sources, it doesn’t work alone. Direct traffic is not really direct for two reasons. 1. The way all analytics tools work is that if they can’t identify the source, they will call the visit direct. 2. Even if it all really was direct – people typing the url in the browser bar, direct traffic is hard to analyze on it’s own because something else always has to cause it to happen. You don’t go typing in a URL in your browser without learning about that URL from somewhere else. You can never really know what initiated someone to come to the site directly. So direct isn’t really a source, it’s an action. A better label for direct would be unknown.

Direct being unknown is not necessarily a bad thing. Direct traffic should be used in conjunction with analyzing all other channels. All the work those other channels do will contribute to direct. This forces you to think of your site’s acquisition strategy in terms of an ecosystem rather than channels working in silos, independant of each other.

How Important Is The Release Date?

Release it all at once or slowly over time? How much effort and money should be invested at the onset? How much buzz a new product needs at the start depends on a combination of how good it is and how long the product will be relevant. The longer you can stretch out the release the better for the customer and the creator.

According to the product adoption curve, the majority of people will wait for the feedback from the innovators and early adopters before deciding it’s worth their time. Money can carry it faster to the early and late majority, but it takes a lot of it. If the product is relevant for long enough, and you’re patient long enough, the product can carry itself into the consciousness of the majority.

It’s tempting to blurt out everything you have to say all at once. For the customer, participating in buzz is fun. Being the one to recommend something to others builds trust – both with their friends and the creator. What your audience wants from you is not just your product, but the ability to be the one to share it with others.

Treat Different Site Visitors Differently

When I used to do sales I would beat myself up about getting rejected. Then I started to keep track of how many people I talked to who were actual decision makers and realized I was mostly getting rejections from people who weren’t the decision makers and couldn’t buy anyway. This made me feel better because I realized my conversion rate was much higher once I got in front of a decision maker. The same applies to websites.

A less than 2% conversion rate seems bad when you think about it; 98% of people don’t buy. But if you were to whittle down the people who were actually there to buy your conversion rate would be a lot higher.

Take a look at all the different reasons someone would come to your site. There are visitors there to check their order status, contact customer service, browse, compare prices, find a store locator or are not interested in buying at all and leave after one page view.

If you can measure all the actions on the site that infer a certain kind of customer cohort than you can build something like this:

Screen Shot 2013-08-23 at 3.11.46 PM

In this graph I’ve spit up all traffic into five segments:

  • Service – visitors checking order status or contacting customer service.
  • No Shot – visitors that show no interest in buying, visit <=1 Page. Who knows why they showed up we have no information on them to infer anything from.
  • Browsers – visitors reading blog posts, relase calendars, looking at
  • Buyers/Instore – choosing the pick up in store option, visiting the store locator, getting driving directions
  • Buyers/Online – behavior that matches that of the Visits With Conversion segment

With this new view in mind you can measure accurately how well your site is converting those shoppers who actually have an intent to purchase. And you can accurately measure the task completion rate of those other visitors there to go to customer service or shop offline. You can also segment these buckets by marketing channel to see how many qualified leads each channel is providing.

Diagnosing A Paid Search Strategy

Paid Search strategies can vary widely. There is a different blend of direct response and branding that each company employs. How much does a company value educating new customers as opposed to getting sales from each click? How often are they testing new keywords to reach different and new target segments? How much are they willing to spend for the sale? What is the target ROAS and how willing are they to deviate from it?

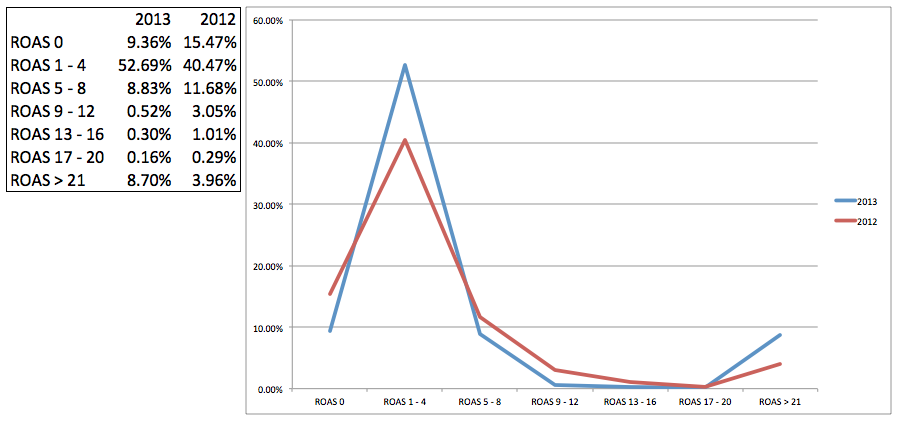
These questions can be answered by looking at the amount of money a company invests at the different levels of Return On Ad Spend (or CPA). If you compare time periods you can see how paid search strategies change.

Screen Shot 2013-08-14 at 4.25.30 PM

In this example you can see that a focus on direct response was increased year over year as that sweet spot of ROAS from 1 to 4 was much more heavily invested in – budget was spread much less evenly across higher ROAS levels. There is always a balance between profit and volume the more evenly the cost is spread out the more evenly the company values both metrics

in 2012 there seems to be more experimentation going on as the amount invested that got 0 return was higher.  Interestingly, in 2013 as the amount of money invested on the > 21 ROAS was much higher. Maybe there were a few pet keywords that even though got low return were important from a branding or competitive perspective. Or impression share on those high ROAS keywords was tapped out and additional budget was given to the wrong keywords.

Paid Search Competitive Analysis Report Template (excel download)

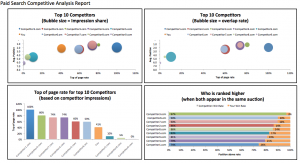
This template is a snapshot for a particular month. It doesn’t show trends or give you the context of growth/decline over time. You can pull the Auction Insights report out of AdWords from a campaign or adgroup and then plug in the top 10 competitors to get these results.

Paid Search Competitive Analysis

Click To Enlarge

Ideally the first bubble chart gives you insight into where you sit in relation to your competitor’s impression share, avg. position and top of page rate. How competitive are you with these other advertisers? If you’re similar size and position expect high costs and aggressive bidding.

The second bubble chart shows the relation of avg. position and top of page rate with the competitors you overlap with the most. The more bubbles of similar size, the more competitive the auction is.

The Top Of Page Rate column chart gives you an idea of how aggressive you are relative to the competition for that data you’re analyzing. Are the competitors that are ranking higher than you also winning out the most when you are in the same auction?

I copied over the colors from the bubble charts to the bar charts so that you can follow one competitor across all comparisons. This way it’s easy to see if a competitor with high overlap rate ranks higher than you when in the same auction.
Is ranking higher than one of your competitors important to you? With the Who Is Ranked Higher chart you can see how often that is happening and with the other column chart you can see how competitive they are overall.

Download the Paid Search Competitive Analysis Template (.xlsx)

Ecommerce Blog Dashboard (Excel Download)

Many ecommerce sites have blogs as a means to drive traffic, help with SEO, drive new visits, engage with customers, make sales, increase credibility and more. All of the goals can fit into two silos: engagement and driving revenue to the site. The two depend on each other – the better the content the more potential people will click through to the site and purchase.<

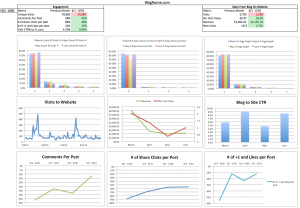
I built a dashboard for measuring the success of these two silos on a monthly basis. Check it out:
Click to embiggen

Click to embiggen

Measuring engagement has multiple facets. How well does your content attract new visitors, get people to come back, bring in others via social sharing and just be all around worth reading? The top left column pulls in those metrics of measuring how engaging the content is by using comments, shares and likes as a proxy for quality. Likewise the first row of bar charts shows the count of visits, days since last visit and page depth – pulled from Google analytics, over the last 4 months. Seeing these trended out gives you an idea if your content is getting better or worse over time – same with the line social graphs in the bottom row.

Next, how well does the blog get people to buy from your site? The first step to driving a sale is to get people from the blog to the site, so the Visits to Website line graph and the Blog to Site CTR shows how many, and with what frequency people are clicking through. The middle chart on the middle row shows overall revenue and per visit value.

A dashboard is only as good as the actionable insights one can glean from it. This dashboard shows (the numbers are all made up mind you) that last month the content got better – people commented more, shared more and Liked more. The next step here would be to pull the All Pages report for the month and see what kind of content resonated so much, and then make more of it.
Despite less traffic overall the quality of traffic to the site increased as Per Visit Value increased – too bad not more people aren’t clicking through to the site, maybe more links to the site could help that. Were the links to the site product pages, category pages, the homepage?
More questions: Did the new visits this month convert? The count of visits from last month were higher, was there a theme of content that you stopped using this month? Anyway you can add onto the content that drove the spikes in visits from previous months? How does your cadence of posting affect the volume of traffic?

Download the Ecommerce Blog Dashboard in Excel.

Making the Vaguest Marketing Objectives Measurable

Almost every marketing proposal and brief include one or more of the following meaningless goals: drive awareness and increase engagement.

Of course we want to drive awareness and/or increase engagement. What is marketing if not one or both of those things? The point of marketing proposals are to allow the thinkers on the team to collaborate and then give those ideas outlined to the doers on the team. Proposals, like most endeavors, are garbage in – garbage out. The more vague the objectives and strategy the more vague the results will be. So let’s how we can boil down “awareness” and “engagement” into unique actions that we can measure and get better results.

Objective #1 Drive Awareness
Awareness to who? Certainly not everyone. Moms with kids? Traveling businessmen? Baby Boomers? Teenager jocks? Go one step further and say “Drive Awareness to ________.” Then the doers can measure themselves against how well they are reaching that desired audience. Age and gender reporting are easily accessible in AdWords from the Google Display Network.
Also by using the myriad ways to overlapping contextual, interests one can measure the CPM and CTR of getting in front of the coveted demographic.Targeting new customers or return customers is also a consideration – how well can you reach past purchasers of product x who might have an affinity for the new product y? Remarketing lists can also be a useful tool to measure awareness. Getting the message in front of visitors who browsed certain categories or similar products can be counted as success. All of these tactics drive awareness and give you ways to measure how well that awareness was achieved.

Objective #2 Increase Engagement
Engagement is subjective and web analytics tools are inherently unable to measure the kind, positive or negative, of engagement and are left to only measure the degree of engagement. Measuring the degree of engagement is going to be unique to the experience of the site. Maybe it’s the amount of contest submissions, tweets, comments, video plays, likes, it all depends. There are a few standbys however: loyalty, recency, length of visit and depth of visit (all located under Audience > Behavior in Google Analytics. With all of these metrics see what the site average is and then use that as a baseline to achieve against.

So instead of being meaningless, an example objective on a marketing proposal could say:
“Drive awareness to our target 25 – 35 mothers with children who are trying to save time and increase the value of quality time spent with their families.”
Or
“Increase engagement by reaching more than X contest submissions while driving X new visits through user generated social shares.”

A Web Analytics Measurement Model Strategy

We no longer live in a world where only last-touch direct response metrics suffice. The web influences both online and offline sales, every customer surveys competing sites and brands, they spend more time researching online and they research across multiple devices. This makes for a very convoluted purchase funnel. As people continue to browse constantly the amount of touchpoints before a purchase will continue to increase. So the question becomes how to quantify the value of all those touch points and create a strategy for growth?

Avinash has multiple great posts on this subject  micro-conversions, net income & goal values.  I’ve tried taking all of this in and meld together an approach to make all of these ideas work together. You should read Avinash’s posts first and then take a look at my conclusion. So I see three steps to putting together a strategy that values all the objectives of a website.

Step 1: Quantify All Actions Taken On The Site.

Look at all the micro-conversions that take place on the site and calculate their worth. This takes some creativity. You end up with something like this:

Micro-Conversion Value

Step 2: Extrapolate Those Value Across All Channels

You’ve deduced how much a new email subscriber is worth, now multiply that value to the amount of email subscribers organic search has driven in the last week. Do this with each metric and each channel and you’ll end up with a report that encompasses the value that each channel has for each micro-conversion. This is a good looking weekly report to show how the site is doing overall. But where should you focus?

Micro Conversion Report

Step 3: Focus Strategy Going Forward Based On Categorization Of Micro-Conversions

At a very simplistic level most businesses work under a pretty basic premise: buy stuff at one price and then sell it for more than you bought it for. There are four main strategies to do this: price strategies – sell at a higher price, cost strategies – sell at the same price but lower your costs, market share strategies – take more customers from your competitors, & market size strategies –  go into new places where you haven’t sold before.
Divide your micro-conversions and other metrics that are important to your business into one of the four buckets.  Now if you want to focus your strategy on volume you know the micro-conversions and metrics that each marketing channel should be driving to.

Micro Conversion Net Income Strategy

Online Marketing Moving Towards Passivity

Online marketing has been positioned from the beginning as a much more interactive marketing medium than TV. As the web becomes more of a constant thing in our lives will our interactions with it become more passive like TV and thus change the way we market online?

Online marketers have always stuck their noses up at TV advertising because they couldn’t believe advertisers would spend so much money on a medium that was not trackable, was interruptive, was not precisely targeted, had no ability to engage the user further once the ad ended, was not shareable. Surely TV ads are inferior.

But when the amount of time people spend online is constant you need new math. The number of sites visited before a purchase as reported by google is growing exponentially – is this because people do more research or is it just because people spend more time online? When browsing is something that never ends, creating attribution models around touch points that weave in and out of constant browsing habits start to look futile. The sheer fact that someone showed up at your ecommerce site used to be a pretty strong signal of purchase intent and every time they didn’t convert was deemed a failure. Now, with mobile usage skyrocketing the value of a visit is dropping fast.

In the end the traditional principles of TV advertising – where you interrupt and grab attention by inserting advertising into an appealing environment and then make that advertising message entertaining, beautiful or interesting is maybe all that may really works after all. The majority of online advertising hasn’t been focused on that as much as it’s been focusing on precise targeting, number of “likes” and optimization.

Should You Pay For A Paid Search Bid Management Tool?

Bid management tools (Marin, Kenshoo, Acquisio, DoubleClick For Search) tout productivity, and increased efficiency but not without a hefty cost – charging 3% – 5% of spend. So is it worth it? Here are some of the pros and cons these tools promote and a comparison of what you get for free from AdWords:

  •  Cross-Publisher editing is a big feature. When you see both AdCenter and AdWords in the same place it’s much easier to manage and strategies can be spread seamlessly across the two.
    • No arguments here, obviously Adwords will never give you the ability to edit AdCenter in it’s interface.
  • Doing bulk edits by downloading data into a spreadsheet, making edits, and then re-uploading is essential for increasing productivity across thousands of keywords and ads.
    • AdWords editor does this for free (but not across publishers) and it’s a pretty new feature in AdWords as well.
  • Customizable dashboards allow you to make better reports faster which allow for better analysis.
    • If you’re not content with the charts in the AdWords interface, you’ll need to use spreadsheets which are slower but you can make them exactly how you want and aren’t limited to the features of the dashboard tool.
  • Flexible auto bidding algorithms allow advertisers to manage millions of keywords and ads effectively. Bidding algorithms look at all the possible signals available to decide what to bid so you can reach a desired CPA or ROAS which would be too difficult for any one person to do manually.
    • AdWords Conversion Optimizer is competitive with other tools as it is the only bidding algorithm that makes bids in real time, the rest do so reactionary through the API. Also, AdWords allows adding any keyword to Conversion Optimizer regardless of account structure making it pretty flexible. What it doesn’t have (yet) is options outside using a target CPA to optimize instead of a target ROAS.
  • Dynamic account expansion allows large advertisers to create campaigns, adgroups and ads much faster using their product feeds and smart software.
  • Conversion attribution allows you to give keywords different levels of credit depending on what point they were clicked on in the funnel and use those rules in your bidding strategy.
    • With AdWords you can get insight with the Multi-Channel Funnel reports and more insight if you use Google Analytics but its not easy to incorporate learnings into bids.
  • Customizable alerts that allow you to get an email if a swing in traffic or drop in CPA happen to a specific campaign/keyword/adgroup
    • Automated Rules in AdWords allows you to send emails that get triggered for changes in any metric.
  • Tag any element of your account to easily find and schedule anything.
    • Adwords uses Labels to the same effect and also has Automated Rules but they don’t work with Labels.

Also consider:

  • When AdWords comes out with new features it usually releases them in AdWords before making them available in the API so things like Dynamic Search Ads are not available in many of these tools that rely on the API.
  • Enhanced campaigns are taking a lot of the complexity away that justifies these bidding tools – consolidating duplicated and triplicated campaigns for device, time and geography.

You can see that most features are mostly marginally better than what you get for free from Google. In my opinion, a bid management tool only make sense for very large advertisers with small SEM teams. I think their value propositions will continue to run thin as Google ups its investment in AdWords editor and the AdWords interface.

The real reason why many people use these bid management tools is because it takes the responsibility of paid search away from themselves and gives it to an algorithm. A computer can look at many more signals than a person can look at, make thousands a tweaks to bids at a time and learn as it goes – who can argue with a search manager that it’s not a good decision to invest in a tool like that? Besides whatever increases to ROAS it provides it also gives you a justification and an excuse to upper management if the program goes well and if it goes wrong.